Facebook: 2.8 Billion Visits, 21.9 Visits / Unique in February

January marked the month where Facebook passed Google in visits and Yahoo in Uniques. Today, Compete released their February 2010 numbers and the trends continued:

1. Google remains the largest by reach (with 141m uniques) and Facebook has gained some distance ahead of Yahoo. All three sites dipped consistently (4.3-4.9%) from January.

Google: 141.3m uniques Facebook 127.9m uniques Yahoo: 125.4m uniques

2. Facebook is the largest in terms of visits - really pulling away from Google (2.8b vs. 2.5b). Again,all three sites declined - but while Facebook's decline was 2.5%, Google and Yahoo dipped 9.2 and 12.7% respectively... which is turn created separation between Facebook and the others.

Facebook: 2.8b visits Google: 2.5b visits yahoo: 2.2b visits

3. Google and Yahoo each see 17.8 visits per unique. Facebook sees 21.9... a substantial difference.

4. It is also interesting that Google's top "referral" and "destination" site was Facebook (Yahoo was #2 and YouTube #3).

Facebook Represents 7% of all Internet Visits

According to new Hitwise data, 7.07% of all internet visits go to Facebook. Google is the second largest at 7.03%. And Yahoo is a distant third at 3.67%. Equally impressive is how quickly Facebook has gained on Google - since January, they have jumped from ~6.5% to ~7.1%. Much of that acceleration happened in the last thirty days. Just a year ago, Facebook represented ~2.5% of visits.

This data comes a few weeks after Compete released their January report where Facebook surpassed Google in aggregate visits. Furthermore, if Facebook now represents greater internet share by visits, you would imagine that they are therefore significantly ahead by time on site. Google's in-and-out experience combined with Facebook's single-page structure likely result in Google winning the page-view war.

Read more at TechCrunch.

January 2010: Facebook Passes Google in Visits; Yahoo in Uniques

According to Compete, January marked the month where Facebook passed Google in visits and Yahoo in Uniques... both are major accomplishments. Even if Compete's data is not directly tracked - this is important directionally. In December, Facebook inched above Google in visits (2.71b vs. 2.69b) - but January marks an actual gap: 2.87b to 2.78b. The other impressive feat is that Facebook's growth rate maintains its (almost-linear) strength. Google's visits continues to grow, but it is clearly slower; their uniques have seen growth over the last couple months, but May - November was relatively flat. Meanwhile, Yahoo visits are flat and uniques are declining. It is also worth noting that Facebook is the top referral site of Google... meaning that many of Google's visits lead directly to Facebook visits (as is the in-and-out model of search). Google is the second largest referral site from Facebook - Yahoo is the largest.

Facebook vs. Google: Visits

Facebook vs. Google vs. Yahoo: Visits

Closeup of Visits: Facebook Passes Google

Facebook vs. Google vs. Yahoo: Uniques

ComScore Announces Self Service Model - Coming After Quantcast?

At the poorly-attended breakfast session at TechCrunch 50 (maybe because its 8am) - ComScore has announced quietly that they are releasing a self-service model "in the next few days". A publisher will be able to tag their own site and then collect standard ComScore reporting metrics.

This places them directly across the table from Quantcast and opens them to smaller publishers who traditionally cannot afford to work with ComScore. It is yet to be seen how ComScore will treat their self-service (supposedly free) model with their revenue-based model (which is prohibitively expensive for most).

Quantcast is the clear leader in the self service space. Compete is trying to differentiate themselves through premium data. To date, ComScore has served the large publishers... interesting to see what traction ComScore gets with the smaller publishers... there is only room for so many tracking pixels on each webpage.

Also interesting to note that ComScore has now mentioned Quantcast in passing a handful of times during their presentation.

Dunkin' Donuts Aren't in California... Yet?

It's July 4th weekend and I'm in Cape Cod... which means that I've now enjoyed several Dunkin' Donuts iced coffees and wondered why the only DD coffee I can enjoy in California is brewed at home.

Every day, my blog gets a fair amount of traffic coming from Google for search terms like:

- Dunkin Donuts California - Dunkin Donuts in CA - No Dunkin Donuts in California

And so on. Those aren't short / intuitive queries ... and they occur thousands of times a week. I've even gone as far as to suggest a business model around natural search logs considering that Dunkin Donuts would likely find this information interesting. I've received offers to sponsor pages based specifically on the keywords it ranks well for. According to Compete, "Dunkin Donuts California" is the #1 affinity query to my site (I wouldn't go quite so far...):

Search Google Maps for Dunkin Donuts and the only result is in California... and it's a closed location that has a request to shut down this listing:

According to Quantcast, "Dunkin Donuts" is the 1,700th most common search query on the web... yet despite California's size, population and collection of Boston-transplants, there isn't a single Dunkin Donuts in California. Why?!

Long Tail Analytics with Quantcast, Google Trends & Compete - Who Wins?

Google entered the public web analytics game yesterday by expanding Google Trends beyond search queries and into web traffic. Just a couple years ago, we had two options for web data: - Comscore provided detailed analytics for the web's top sites - Alexa (inaccurately) estimated traffic based on their tool bar users / usage

Now, we have three major players offering analytics for the tail of websites: Quantcast, Compete and Google Trends. Quantcast is, at this point, the only player that enables publishers to add tags to their site (or media: flash, network, etc) that effectively share their stats and make them public. This gives Quantcast full information about the site and its visitors (the same way that Google Analytics collects their data); they then share a portion of that information publicly and, for quantified publishers, that data should be trusted: pageviews, uniques, visits, etc. The beauty of what Quantcast has built is that publishers are incented to 'quantify' their sites because it provides a trusted 3rd party representation of their traffic - and for the tail of websites, that's an important differentiator because Comscore only measures the web's top sites.

Meanwhile, Compete collects their data from a panel of users and releases monthly stats (for quantified publishers, Quantcast releases daily updates). Below, you'll see just how different Quantcast and Compete are for PerezHilton.com (who is now quantified). Quantcast shows 9 million monthly uniques and 1.4 million daily uniques - Compete shows about 1.4 million monthly uniques. Big difference:

According to the data (3m uniques vs. 1m) and all of my anecdotal Silicon Valley conversations, Quantcast seems to be the preferred analytics provider over Compete.... but the real wildcard is clearly Google. The Google Trends launch garnered huge buzz yesterday - but it's yet to be seen how big of a step Google is actually taking. You'll notice below that Google Trends shows 600k daily uniques for PerezHilton.com - which falls between Quantcast and Compete... which leads to me to ask the obvious question: Will Google open up Google Analytics publicly on an opt-in basis? Quantcast has pushed Compete aside by gathering real data provided directly by the website owner. Google already has a massive footprint in Analytics - by providing an option to "make your data public", they can create a consumer-facing analytics service and extend the reach of AdWords / AdSense by matching demographics and allowing direct ad-buying.

The integration is easy and leverages Analytics massive user base. More importantly, it delivers accurate data and makes Google Trends relevant - because, as it currently stands, the data is good just that: trends.

Google Trends Launches - Apparently I'm Techmeme's 3rd Most Overlapped Site? (No Way!)

Google today announced that they are moving Google Trends closer towards Quantcast and Compete's territories... This is potentially big news - but it depends on how transparent Google decides to be and how well integrated they work with Google Analytics. I've written before that Analytics users should have the option to turn their data public... I'm not sure if this is actually the first step in this direction, but it doesn't appear that way with this current release (which reveals trends without numbers). It is also clear that Google has some work to be done. Below is the Trends chart for Techmeme and apparently my blog is Techmeme's 3rd most overlapped ("also visited") website. I wish that were true... but I doubt it!

Google trends for Techmeme:

Also visited: 1. scobleizer.com 2. inquisitr.com 3. ryanspoon.com 4. louisgray.com 5. centernetworks.com 6. memeorandum.com 7. summize.com 8. friendfeed.com 9. furrier.org 10. gigaom.com

Using Compete.com to 'Understand' Techmeme and Its Audience

If you’ve read this blog often enough, you’re aware that I’m a big fan of Quantcast. I’m also a fan of analytics software / providers and was excited to try out Compete’s new pay-per-usage analytics program. Compete now offers detailed data about websites or verticals – providing:

- Top Keywords, ranked by volume. - Site Share, percentage of all search referrals to a site via that keyword. - Keyword Engagement, index representing average amount of time spent after entering the site via that keyword. 100 represents that term resulted in the most time spent on the site. - Keyword Effectiveness, index that combines the total number of people referred by the keyword and the amount of time those people spent on the site. 100 represents the most effective term.

Conceptually, I love Compete’s model and would be willing to pay for usage… of course assuming that the data is accurate. I was skeptical at first considering that, unlike Quantcast and Google Analytics, Compete doesn’t have the most accurate form of data: embedded tracking on my site.

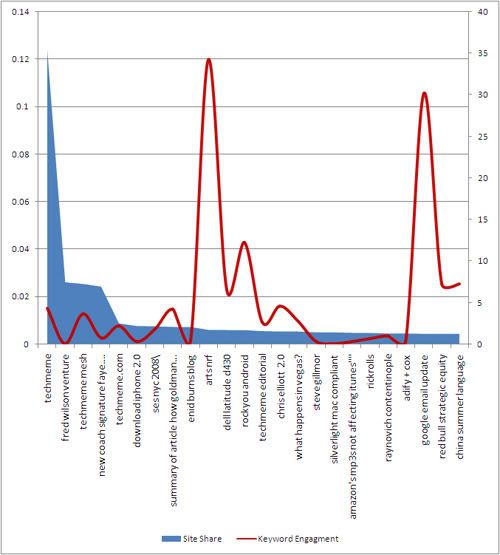
… My hypothesis was right. I pulled data on Techmeme and the results appeared fishy:

#1. Techmeme (12.4% site share, 100% keyword effectiveness)… obviously #2. Fred Wilson Venture (2.6%, 0.14%) #3. Techmeme Mesh (2.5%, 17.5%)… obvious again #4. New coach signature faye wedge shoes slides sandals (2.4%, 3.4%)… wtf? #5. Techmeme.com (0.9%, 3.8%)

Would you pay for data that accurately suggests that your branded keywords are effective? Even more problematic is that the unbranded keywords (what you really want) are clearly way off. Fred Wilson is thematically relevant, but shouldn’t be the #2 keyword by volume (or any other measure) - if it really is a blog, it would be TechCrunch (which represents 8% of Techmeme headlines). The below chart not only shows the bizarre variety of keywords, it shows the problem with including brand-related keywords within such data sets: they represent such a large portion of traffic that the it becomes impossible to compare the remaining data:

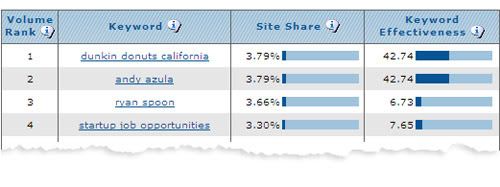
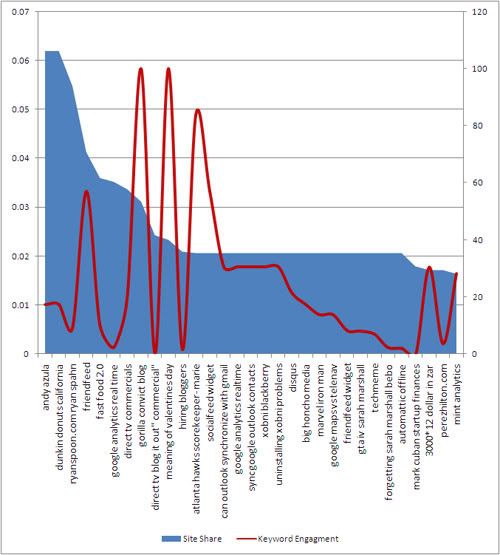
I obviously don’t have access to Techmeme’s logs, so just to validate that this data is troublesome, I ran the same report on my blog. The results were better (probably because I have less traffic and data to work with) – but still raised some serious questions. I’ve charted out the top queries below and, for the most part, am impressed with the keyword portfolio (except for bizarre entries like “Ryan Spahn” and “gorilla convict blog”, #3 and #8) - but the keyword volumes are way off.

I applaud Compete for pushing metrics into new, potentially powerful fronts. Unfortunately though, I’m not sure the data supports it yet. Additionally, Quantcast provides the same sort of keyword, audience and demographic data … which better accuracy… and for free. The first rule of thumb with analytics is accuracy is critical. And if you’re charging for that data - it really needs to be accurate.

Ron Paul Dominating the Web According to Compete.com

Last week I posted about using Quantcast to predict the 2008 election - and suggested that Obama and Romney were favorites based on a combination of aggregate numbers and acceleration of traffic. That post resulted in a roasting by Ron Paul fans (on Digg, on Ron Paul fansites, etc), leading me to check Compete.com for comparable charts. According to Compete, Ron Paul has multiples more traffic AND accelerating at a significantly greater rate.

Blue = Ron Paul Red= Mitt Romney Green = John McCain